LVMC Community Update, September 18, 2020
- Category: LVMC Updates
- Posted On:
- Written By: Steve Popkin

Dear Lompoc Valley Community:
Today we will start a new “feature” …What happened on this date in history?
In 1972, the TV series M*A*S*H debuted on CBS. In 1970, 27-year-old rock star, Jimi Hendrix, died in London. In 1851, the first edition of the New York Daily Times, which became the New York Times, was published.
COVID-19 Information
Criteria for Evaluating Sectors.
Shown below is the stated criteria the State of California uses to determine low, medium, and high-risk sectors, and then determine which sectors may open in the various tiers.
- Ability to accommodate face-covering wearing at all times (e.g. eating and drinking would require removal of face covering)
- Ability to physically distance between individuals from different households
- Ability to limit the number of people per square foot
- Ability to limit the duration of exposure
- Ability to limit amount of mixing of people from differing households and communities
- Ability to limit amount of physical interactions of visitors/patrons
- Ability to optimize ventilation (e.g. indoor vs outdoor, air exchange and filtration)
- Ability to limit activities that are known to cause increased spread (e.g. singing, shouting, heavy breathing; loud environs will cause people to raise voice)
Deaths Per 100,000 Population, By State.
The listing below will provide an indication of which states have (and have not) been hit the hardest by Covid, relative to the respective size of their population. The number of deaths per 100,000 population ranges from 5 for Alaska, to 180 for New Jersey. (For reasons I am not sure, New York State was broken down into two components: New York City at 288, and New York State excluding New York City at 80.)
The median number of deaths per 100,000 population is 34. California, at 36, is pretty near the middle of the pack. Although not shown on the list below, Santa Barbara County is at 23, 36% better than California overall.
| State | Deaths per 100k Population |
|---|---|
| Alaska | 5 |
| Hawaii | 6 |
| Wyoming | 7 |
| Vermont | 9 |
| Maine | 10 |
| Oregon | 12 |
| Louisiana | 13 |
| Montana | 13 |
| Utah | 13 |
| West Virginia | 15 |
| Kansas | 18 |
| South Dakota | 20 |
| Wisconsin | 21 |
| Nebraska | 22 |
| North Dakota | 23 |
| Oklahoma | 23 |
| Idaho | 24 |
| Washington | 26 |
| Missouri | 28 |
| North Carolina | 29 |
| Tennessee | 31 |
| New Hampshire | 32 |
| Arkansas | 33 |
| Virginia | 33 |
| Median | 34 |
| Colorado | 35 |
| Minnesota | 35 |
| California | 36 |
| Ohio | 38 |
| Iowa | 39 |
| New Mexico | 39 |
| Alabama | 48 |
| Nevada | 49 |
| Texas | 49 |
| Indiana | 51 |
| Georgia | 60 |
| Florida | 60 |
| South Carolina | 60 |
| Pennsylvania | 61 |
| Delaware | 63 |
| Maryland | 63 |
| Illinois | 67 |
| Michigan | 69 |
| Arizona | 74 |
| New York (excluding NYC) | 80 |
| District of Columbia | 87 |
| Mississippi | 92 |
| Rhode Island | 101 |
| Connecticut | 125 |
| Massachusetts | 133 |
| New Jersey | 180 |
| New York City | 282 |
Percent of California COVID-19 Cases and Deaths, By Age Group, Compared to Population
Observations
- The percent of Covid cases for individuals under age 18 is less than half of their population percentage.
- The age group 18-34 has a significantly higher percentage of cases than its population percentage.
- If we combine the age groups 0-34, their percent of cases is very close to their population percentage.
- The percent of cases for the age group 35-49 is also significantly higher than its percentage of the population (but not as high as the 18-34 age group).
- The combined 0-17 age group represents 22.5% of the population and 0% of deaths.
- The combined 0-34 age group represents 46.8% of the population and only 1.5% of deaths.
- The combined 70+ age group represents 9.3% of the population, 7.3% of cases, and 63.7% of deaths.
| Age Group | % of Cases | % of Deaths | % of Population |
|---|---|---|---|
| >5 | 2.2 | 0.00 | 5.8 |
| 5-17 | 8.1 | 0.00 | 16.7 |
| 18-34 | 35.2 | 1.5 | 24.3 |
| 35-49 | 24.8 | 5.6 | 19.3 |
| 50-59 | 13.9 | 10.5 | 12.5 |
| 60-64 | 5.0 | 8.5 | 5.9 |
| 65-69 | 3.4 | 10.2 | 5 |
| 70-74 | 2.4 | 11.3 | 2.7 |
| 75-79 | 1.7 | 11.3 | 2.7 |
| 80+ | 3.2 | 41.1 | 3.9 |
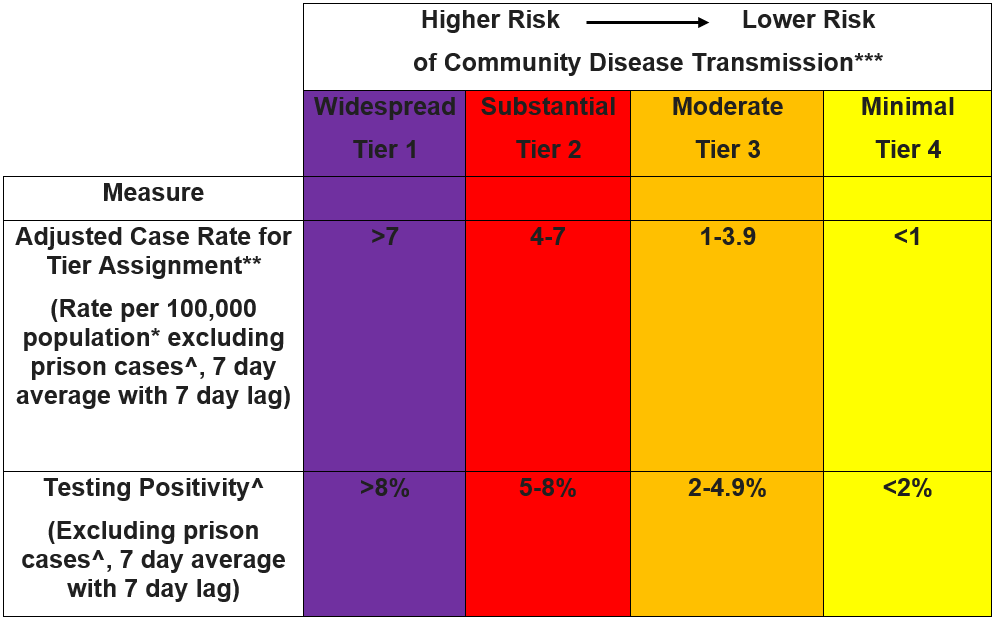
County Tier System
Shown below is a graphic representation of the State of California’s County Tier System. As previously mentioned, a County must remain in a tier for at least three weeks before being eligible to advance to a less restrictive tier, and the County must meet the metric requirements of the new tier for two consecutive weeks in order to advance. A County that is in the red, orange or yellow tier and does not continue to meet the metric requirements for that tier for two consecutive weeks will be downgraded to a lower tier. Counties can only advance one tier at a time.
“Tid-Bits” of Covid Related Information
- The Santa Barbara County positivity rate stands at 5.5%, pending an update expected soon. The 7-day average and 14-day average positivity rate for California overall is 3.6%.
- The average turnaround time for Covid tests in California is 1.3 days. That is the shortest turnaround time since this statistic began being reported on May 31. 66% of tests are completed in 1 day. 88% of tests are completed within 2 days. The average turnaround time peaked at 3.6 days for the week beginning July 26.
- Santa Barbara County Public Health Department continues to receive more school waiver applications. The number of applications received grew from 14 two weeks ago, to 21 one week ago, to 25 now.
- The number of hospitalized Covid patients at hospitals within Santa Barbara County has continued its several week downward trend. As of yesterday, there were 25 hospitalized patients, with only 5 receiving ICU care. This is a decrease from 33 last week and 39 the week before. There is currently 1 Covid positive patient at LVMC.
- Comparing this week’s per capita rate of new Covid cases for Santa Barbara, Lompoc Valley, and Santa Maria, Lompoc Valley was higher than Santa Barbara and lower than Santa Maria. For Santa Barbara, there was 1 new Covid case per 3,150 population (which represents a good decrease). For Lompoc Valley, it was 1 new case per 2,068 population. For Santa Maria, it was 1 new case per 1,627 population.
Thank you, Lompoc Valley Community, for your tremendous support of LVMC and our healthcare workers; it means a lot to all of us!
As always, please feel free to contact me at popkins@lompocvmc.com or (805) 737-3301. Until next time, be well and stay safe!


.jpg)